

Gold is widely accepted as a safe-haven asset during high uncertainty in the market. This is especially true when trading spot gold in the Forex market. Regardless of whether the price of gold rises or falls, traders can also invest and earn profits.
This might have led some investors to feel that gold is speculative in nature. Nonetheless, many investors love trading gold. However, it is one of the more complex assets where prices are influenced by many factors that a trader must consider.
Traders who want to profit from gold trading should have decent knowledge and an understanding of the different factors that cause the price of gold to move. Both technical and fundamental factors are used to make trading more accurate.
We have already provided the fundamentals to assist traders in profiting from trading gold. So, in this article, we’ll be introducing some strategies that may help traders like you make more precise trading decisions and boost their profitability in the process.
If you’re a new trader, start learning some simple strategies that you can use and then go from there.
One of the more popular tools that traders use in their trading is the Fibonacci Retracement. However, some may not know what it is and how to use it in their trading.
What is Fibonacci Retracement?
Fibonacci Retracement is a useful technical tool that can help you determine where potential reversal levels are likely to occur.
Represented by horizontal lines, these levels are also popularly used to identify strategic locations of support and resistance, stop-loss, and price targets. Because Fibonacci retracement levels present static prices, traders and investors can quickly react when price levels are likely to either break or reject.
To identify where these lines are placed, you must determine the high and low points on the chart. The goal is to determine how much of a move a price makes within a trend before a trend resumes.
Fibonacci Retracement works on the idea that a price retraces some of the distance it covered.
It was Charles Dow who proposed that retracements span from 33% to 66%. Ralph Nelson Elliott further refined Dow's idea and provided more accurate levels of retracement.
But why do these retracement levels matter to traders and investors? Because they indicate a potential bullish or bearish reversal. For gold traders, the price of gold tends to stop swinging once a retracement level is reached.
How can we use Fibonacci retracement to help us analyze a profitable gold trade?
As mentioned above, Fibonacci retracement can be used as a fairly accurate indicator of trend reversals in large timeframes. Today I will tell you how to find entry and exit points in gold trading with Fibonacci retracement.
I would like to call this strategy a trend reversal. How can we trade a trend reversal?
Time frame: H4, D1
Key indicators to be used in this strategy are the following:
1. Linear Weighted Moving Average 200

2. MACD (12, 26, 9)

3. ADX 14 (LEVEL 20,40,70 )

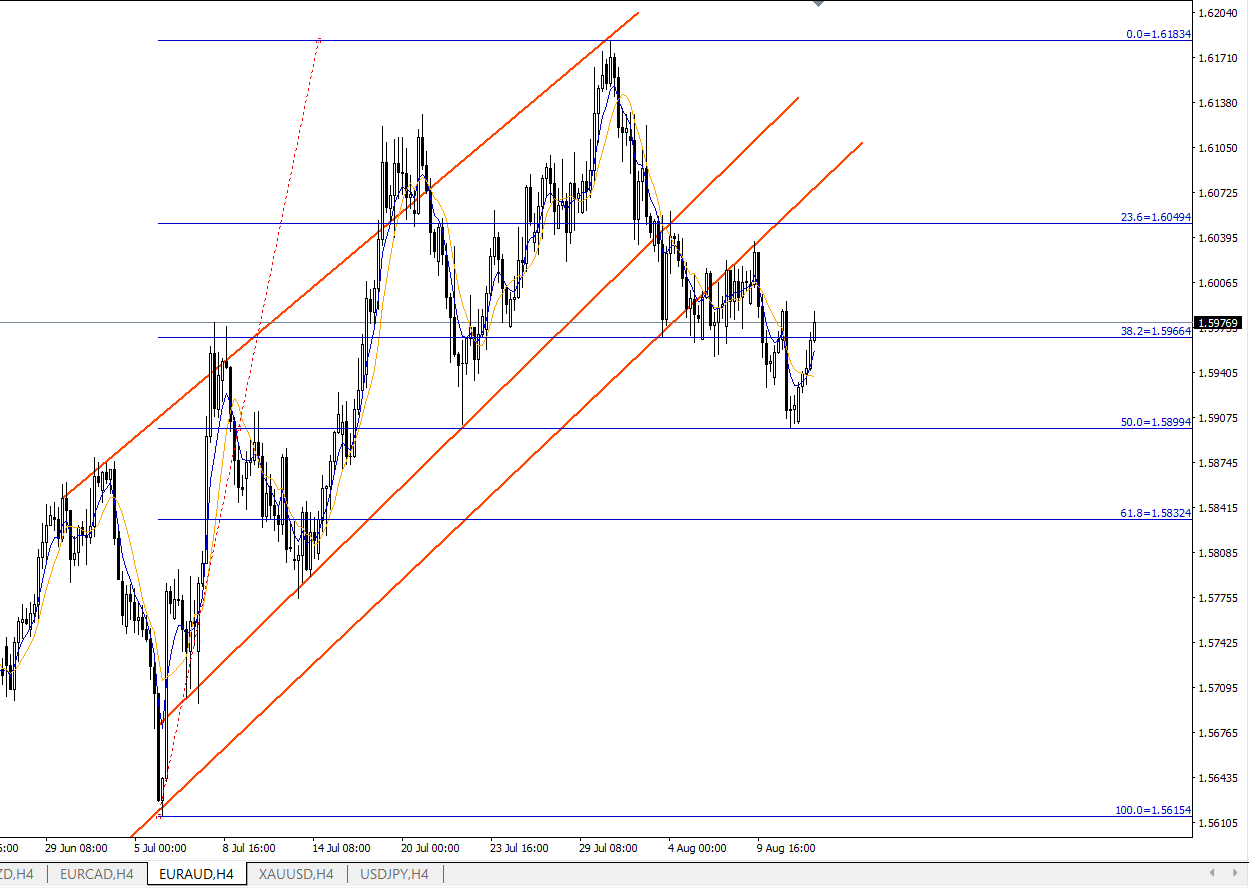
When all indicators are set, you will get a price chart as in the example below.
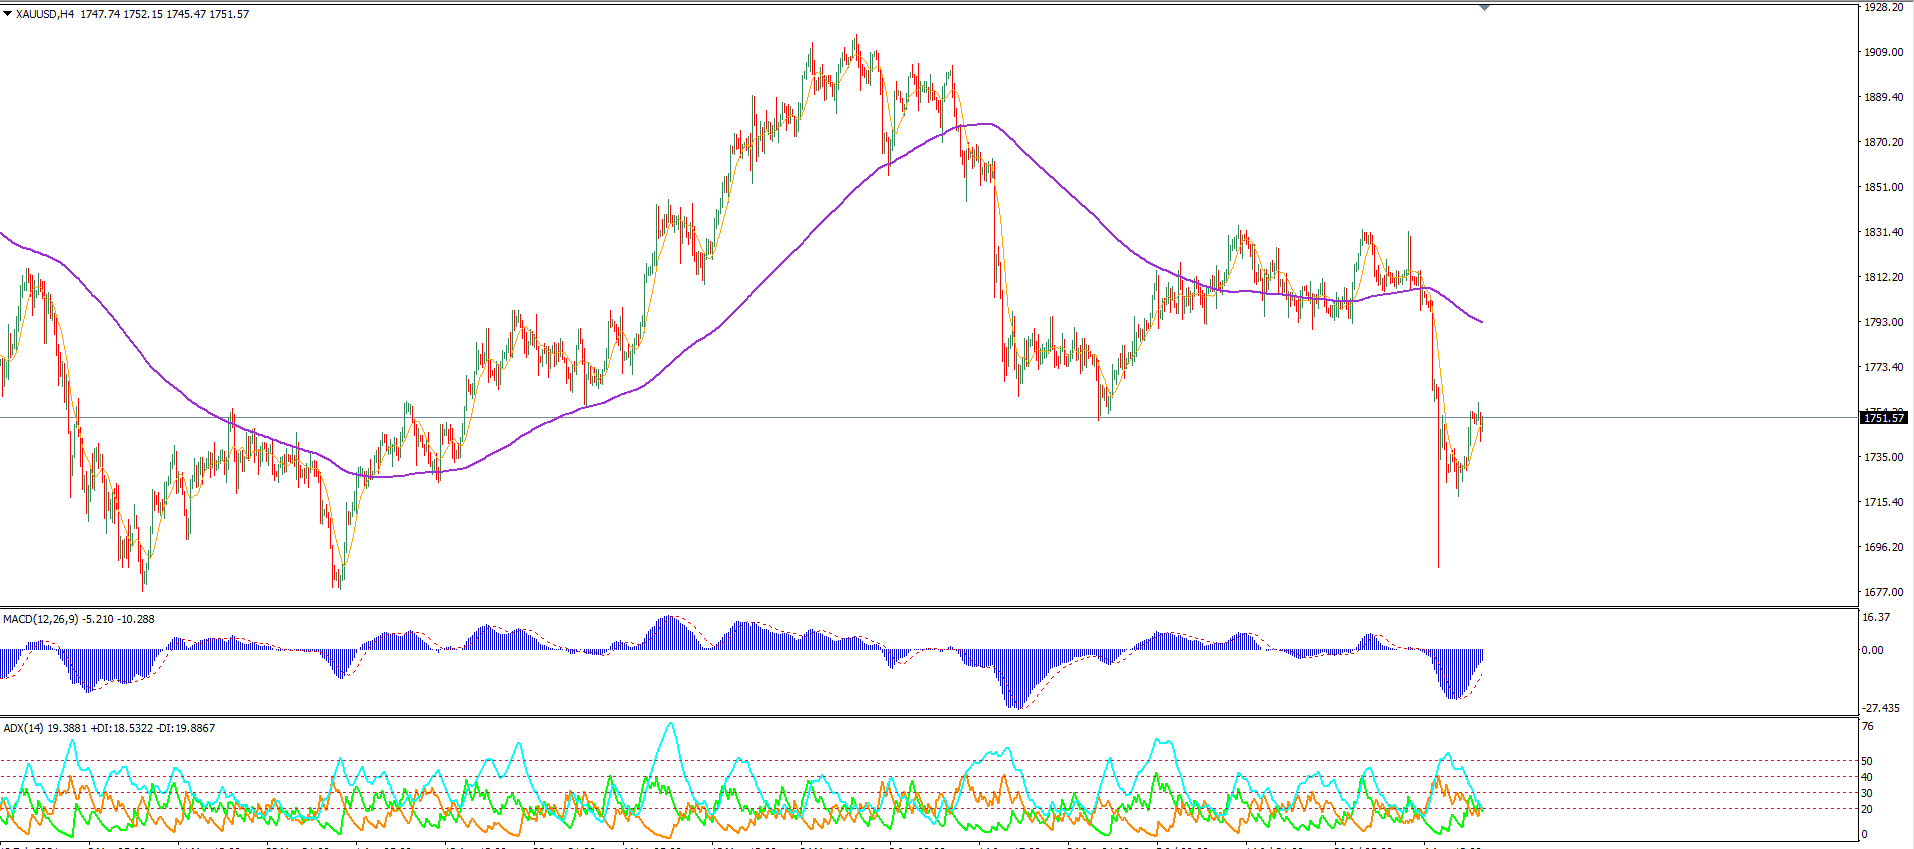
Step 1
When the original trend of the price is a downtrend. We know that the price is a downtrend when you notice that the candlestick hovers below the LWMA 200. Now, look for the last lowest point and the last highest point of the chart. This can be done by looking at the candlestick and comparing it with MACD.
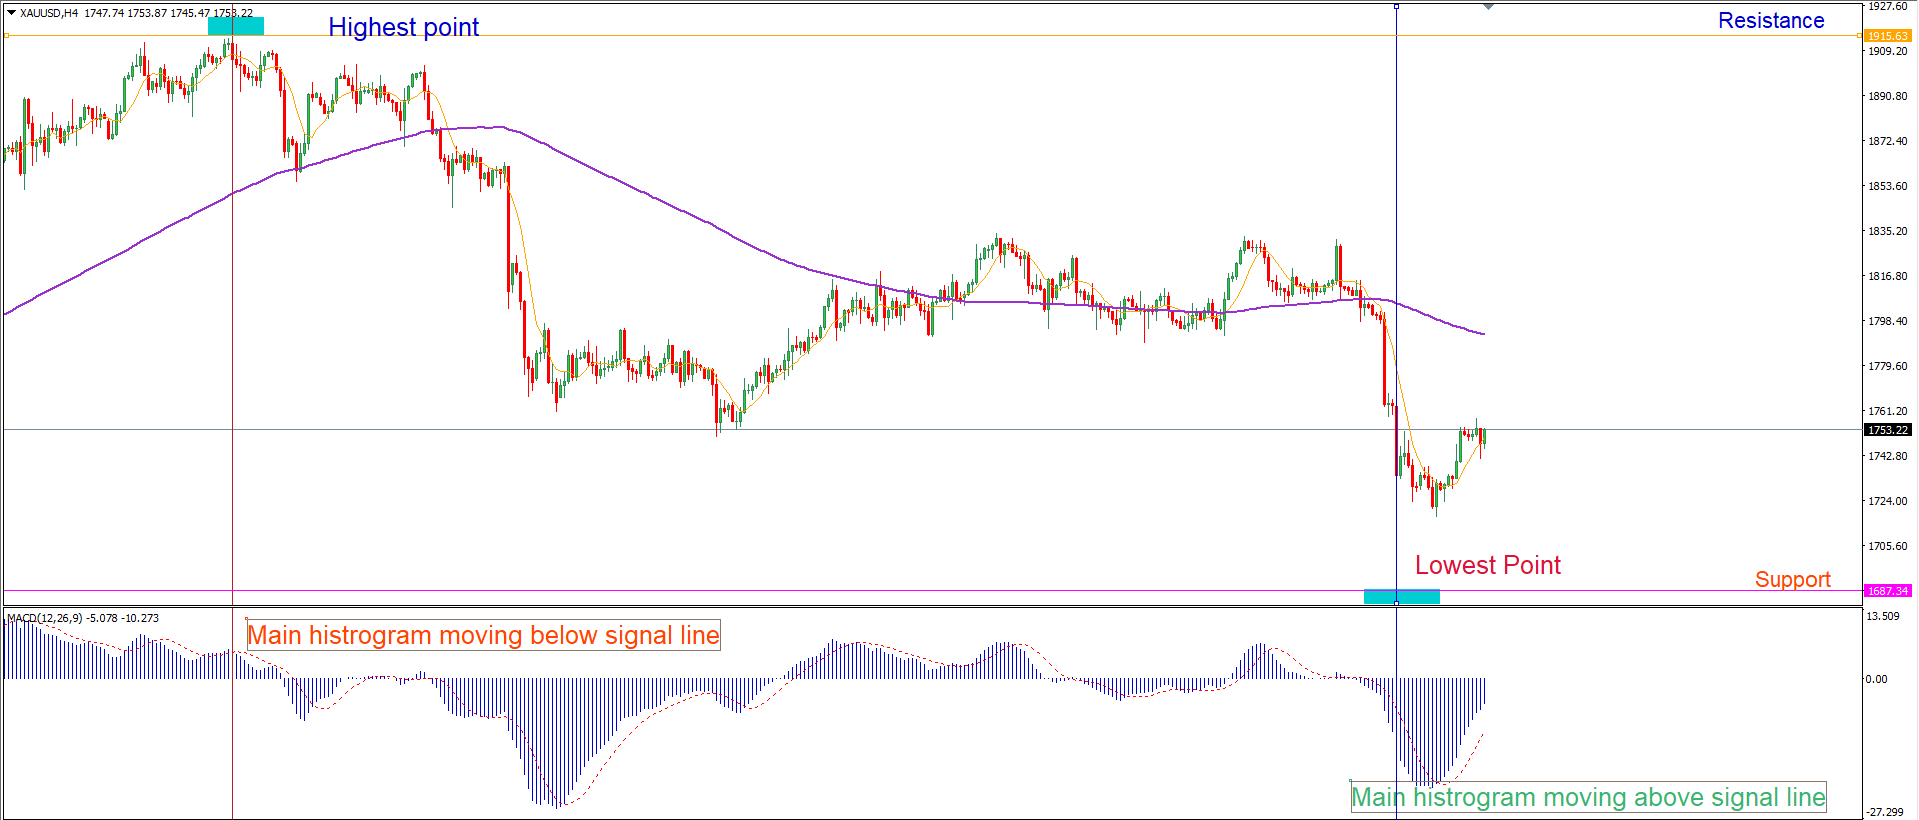
When you see the main histogram moving above the signal line, the downtrend is likely weakening. You can then set up a Fibonacci retracement by putting level 0.00 and level 100 at the lowest and highest points, respectively.

Step 2
The structure of the pattern at the beginning of a trend reversal strategy on H4, D1 usually has a pattern similar to the example below.
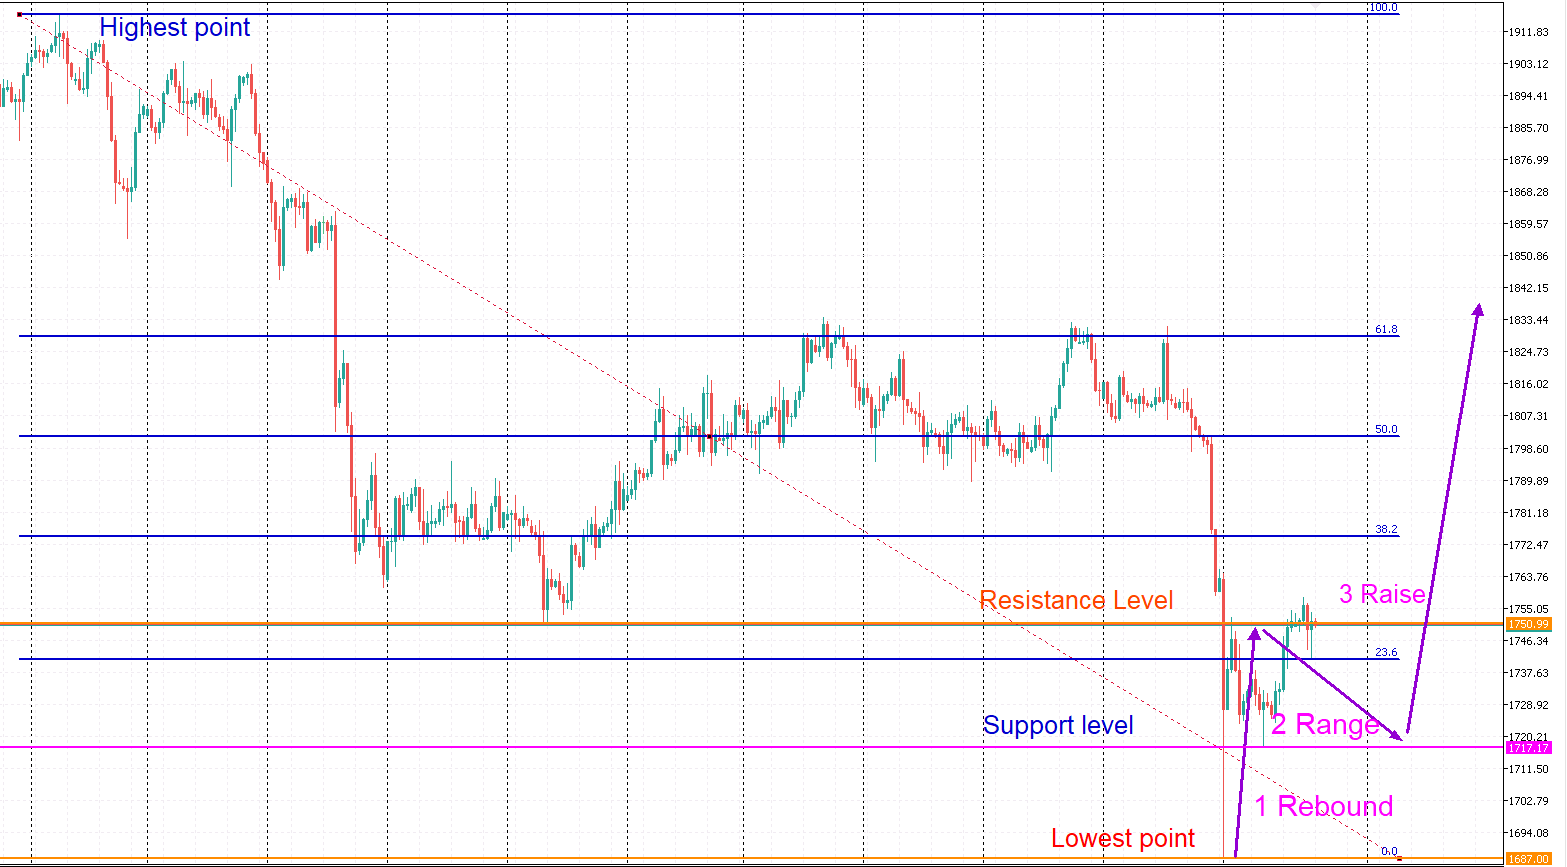
Here's how to determine that the price on H4, D1 chart might have a chance to reverse the trend:
Rebound: Price must rebound from the lowest point (or support level) and subsequently move higher towards the Fibonacci level of 23.6 or higher. However, if the price rebounds from the lowest point but does not reach the Fibonacci level of 23.6, then we will mark it as a weak reversal.
Range: Prices began to slow down and start to move in a narrow range.
Rises (Opportunity to move higher): If the price managed to hold at the support level, this signals that we could see a trend reversal happening. We can look at the ADX D+, it should rise above the 20-level, or ADX, D+ & D- has moved below level 20.
Step 3
Prepare to take a long trade.
Entry price: Above Fibonacci level 23.6
Take profit: Next level of Fibonacci level 38.2, 50.0, 61.8 (We prefer at the 50-level)
Stop loss: Below Fibonacci level 0.00 or use Risk-to-Reward Ratio 1:1.
If it’s a downtrend, take a short trade. Use the opposite method with an uptrend.

Lastly, I take into consideration gold fundamentals to see if they are consistent with our technical analysis. If the two factors contradict, I try to avoid entering trades during that period.
Ready to grow your wealth from the world's largest financial market? No better place to start than right here with us! Start trading with Fullerton Markets today by opening an account:

You might be interested in: How to Profit from Forex Using the Breakout Trading Strategy


