
The breakout trading technique is a popular trading strategy among traders all around the world, and many Forex gurus utilise it in their books or to teach seminars.
In this article, we'll take an in-depth look into how you can optimise breakouts in the market to gain maximum profits.
Quick navigation
- What is a breakout?
- What causes a breakout?
- Is breakout trading profitable?
- What exactly is a "false breakout"?
- How to differentiate real from false breakouts?
- What indicators confirm a breakout?
- How do you use the breakout strategy?
- BONUS: Breakout trading strategy trick
What is a breakout?
A breakout is a condition in which the price breaks a predetermined level.
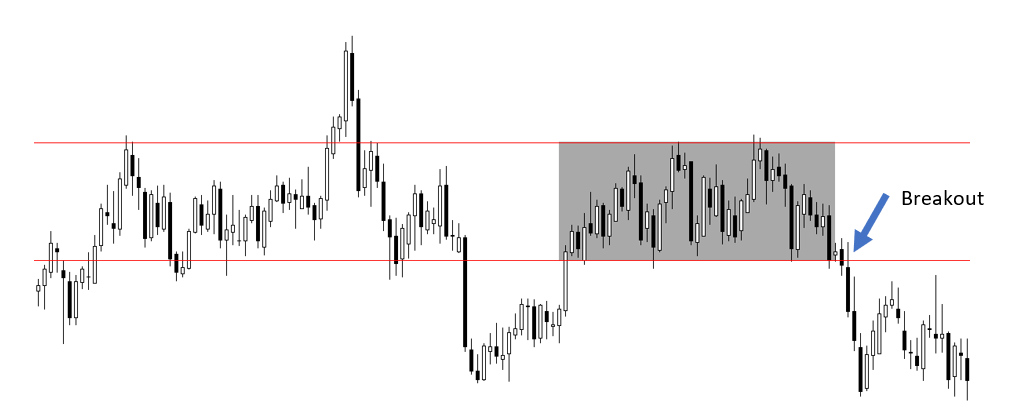
Typically, traders see a breakout when there is a strong support and resistance level that the price manages to break with a certain volume or volatility. The price then continues its movement to the next level of support or resistance.
For example, in the chart below, we can see that multiple levels of resistance and support have previously been constructed, but whenever the price breaks through that level, it moves on to the next level.

What causes a breakout?
A consolidation level forms when the market is evenly balanced between buyers and sellers, as we all know. A breakout circumstance occurs when there is an imbalance between the buyer and seller over a period, as seen by high volume and price volatility.
The market was initially in a consolidation/range, but then there was a large enough movement that it broke through the support and resistance levels, as shown in the chart below.
So, is breakout trading profitable?
There is no such thing as a holy grail in Forex trading. Almost every trading method is successful if executed properly.
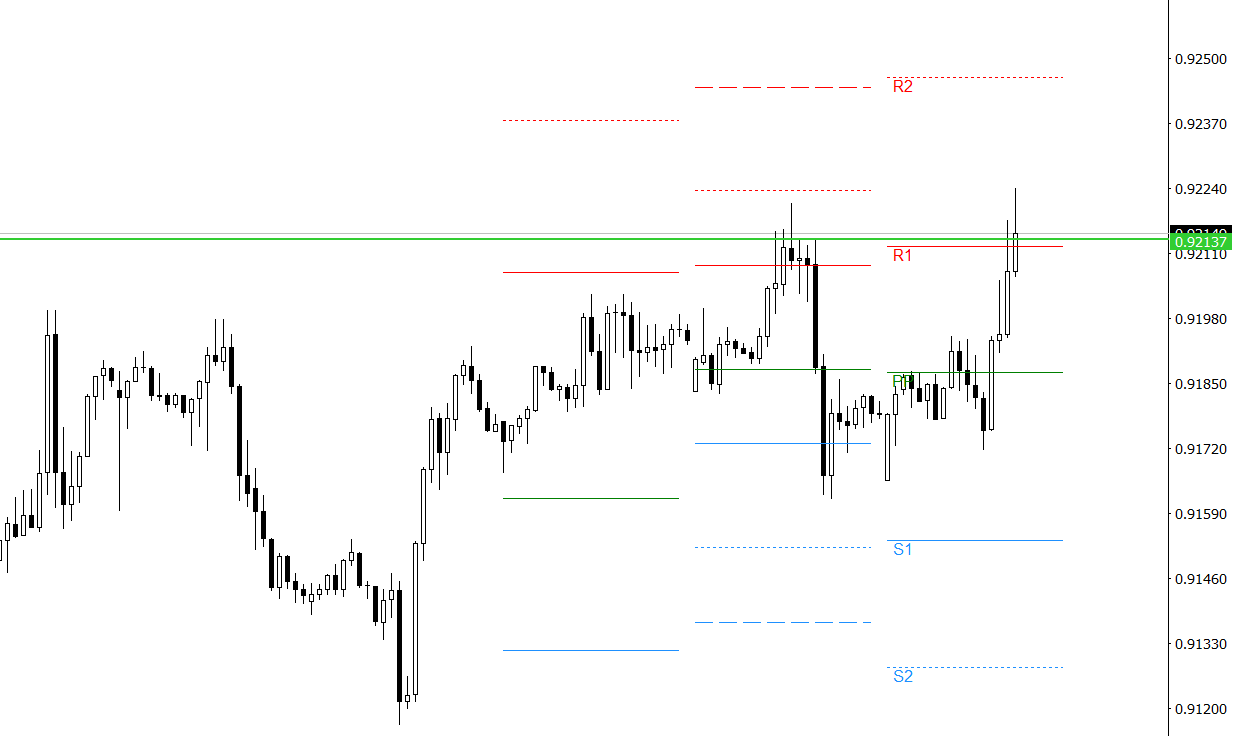
If you wish to utilise a breakout trading strategy, you must be able to determine the levels with the best chance of a breakout, such as strong support and resistance levels, based on visible levels on the chart or by calculating daily pivots.
To put it another way, you must be able to tell the difference between a real and a fake breakout.
What are the pros and cons of breakout trading?
Pros
- Potential for profits can be instantaneous
- Entry and exit points are predefined
- Presents a potential to catch a new trend
- Use momentum to your advantage
Cons
- False/fake breakouts can occur
- No guarantee of an intraday breakout
- Requires quick yet informed thinking and decision
What exactly is a "false breakout"?
A false breakout occurs when the market appears to try to break through a certain level, but instead cancels it and returns to the opposite level.

How to differentiate real from false breakouts?
Because there is no such thing as certainty in trading, it is possible that we will make a mistake in determining the breakout level. However, there is a way to determine whether the support/resistance level we selected is correct.
When determining support and resistance levels, we can use a relatively big timeframe, such as H4 or D1, and make sure that the market has appreciated these levels in the past so that we can consider them strong enough.
If we use the pivot calculation to find support and resistance levels, we need to draw them on the chart to examine if they were previously considered support and resistance.
If we can find at least three prices that are near the support/resistance level, we can consider that the level is solid enough. We can then predict where the price will move with the help of numerous indicators.
The market develops support and resistance levels using pivot calculations, as shown in the example below. But similar support and resistance levels must previously occur.
What indicators confirm a breakout?
There are several indicators that we can use to support us in carrying out a breakout trading strategy.
1. Moving Average (MA)
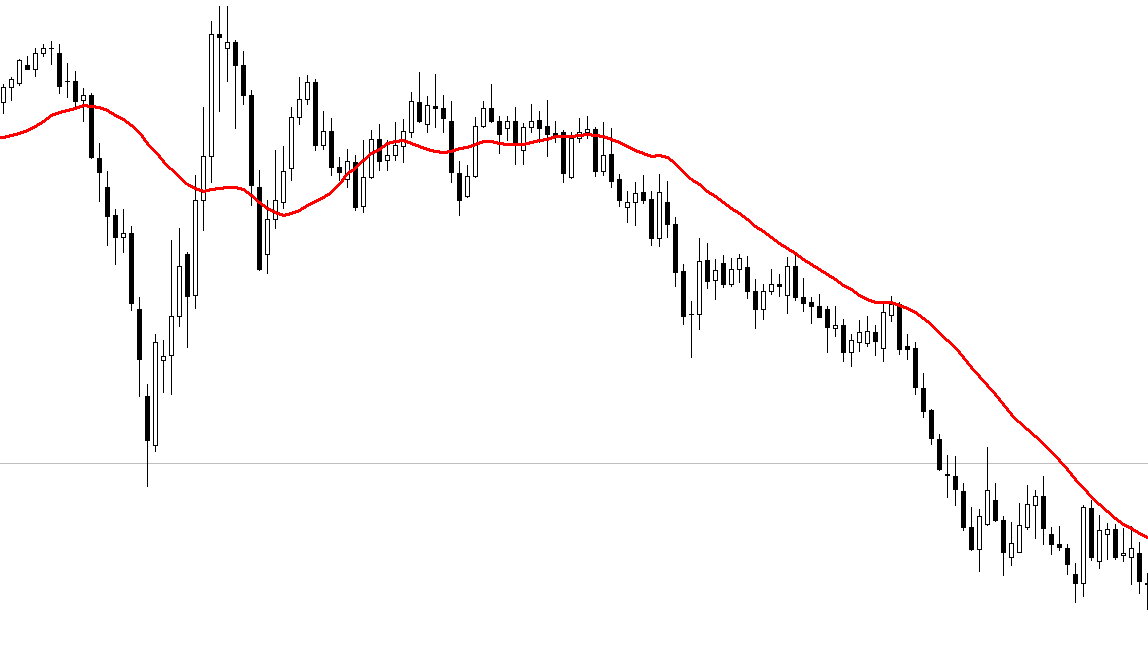
When the market is trending, most traders use the MA. This is why it’s one of the popular indicators used by Forex traders. However, the same indicator can be used to create breakout trading techniques and determine the support or resistance level.
When the market is above the MA, the actual potential is heading up; we can determine the support level using the MA. When the market is consolidating, we can be ready for a breakout using the MA.
When we set a MA and the price is below it, we normally notice a downtrend, and the MA can be seen as a level of resistance. However, after the price has begun to establish a consolidated market, we may start to prepare for the chance that the market will break out the MA and produce a breakout.
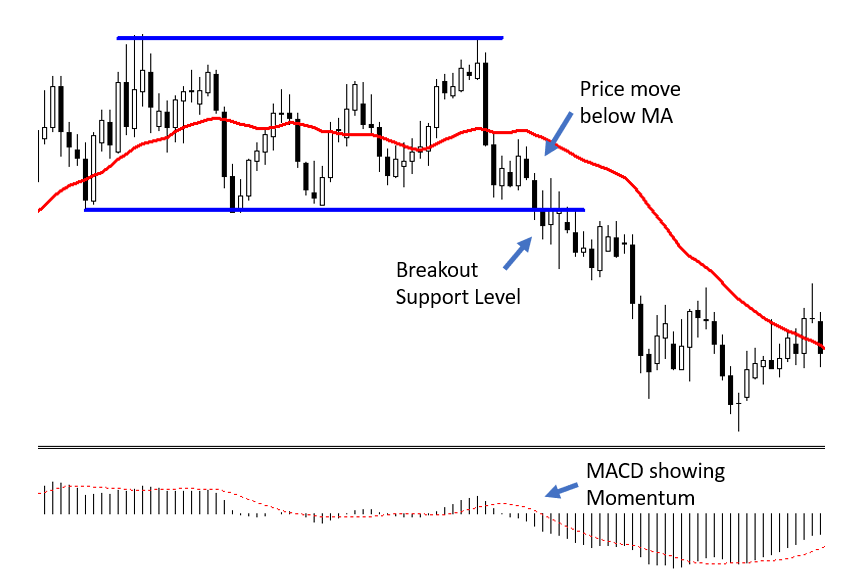
For instance, we can see on the chart below that the market was in a trend. But then price began to create a consolidation region, indicating the possibility of a breakout.
2. Moving Average Convergence/Divergence (MACD)
The MACD indicator is a widely used indicator among Forex traders, and for good reason. It is extremely trustworthy while remaining simple to understand, and it may be studied using the histogram template. When the histogram grows, it implies that the momentum is increasing.
You might be wondering how this can be utilised to detect a trend reversal. The answer is that divergences occur when prices and indicators move in opposite directions. Because MACD is a momentum indicator, it reveals movement when a market trend is initiated. This is a valuable feature since it can tell you whether a trend is about to end abruptly, even if it is still going strong.
We can combine MACD with MA and support and resistance levels like the example shown in the chart below, where we put in 25 MA, MACD and we find support/resistance levels.
When you see the MACD is showing strong momentum and moves above or below MA, we can expect the price to break out the support or resistance levels.
You can then set your entry point at the breakout level and set the stop loss following the MA line or when you see a weaker MACD momentum.
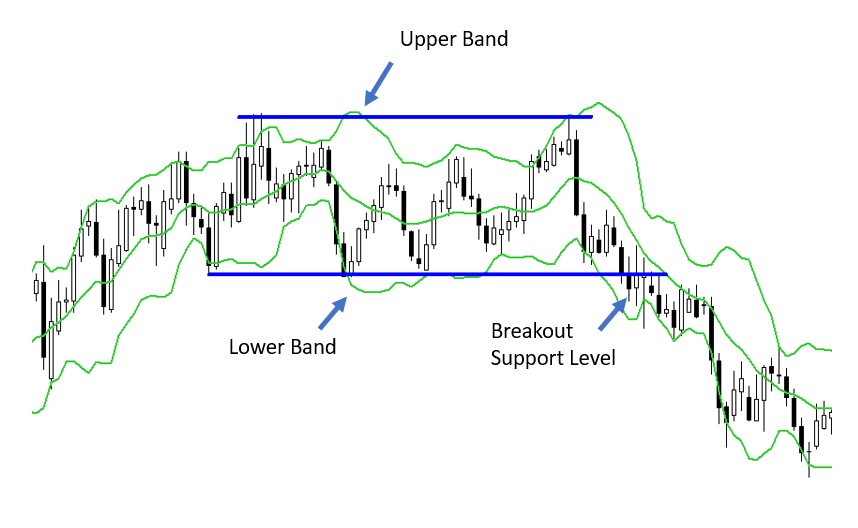
3. Bollinger Bands (BB)
Bollinger Bands are made up of three lines: a 10-day simple moving average (SMA) and two parallel lines that are two standard deviations apart from the SMA. These outer bands are used by traders to spot price extremes that are likely to result in a reversal breakout.
When the price swings outside of either of these outer bands, it is considered an extreme price position with a high probability of triggering a reverse breakout.
Bollinger Bands can be used by traders to open a position on a currency pair whenever the price crosses one of these bands. You might use MACD in conjunction with BB to determine the potential momentum for this breakout.
Also, BB can be combined with support and resistance levels as shown in the chart below to predict a possible breakout.
Keep an eye out for a consolidation movement in price. If you see the Upper Band and Lower Bands of the BB within the same area as the support and resistance, expect a breakout when the price breaks out the support/resistance level.
How do you use the breakout strategy?
When trading Forex breakouts, it's crucial to understand that there are two types:
1. Continuation Breakouts
The market sometimes goes through a period of range-bound movement as buyers and sellers pause to consider their next move. This results in large movements following a single direction.
For instance, a huge number of sellers are taking a breather before deciding on their next step. This will reflect on the market as a period of a downtrend.
This event is known as consolidation.
A continuation breakout occurs when traders conclude that following the initial trend was the best decision and continue to push the price in the same direction.
2. Reversal Breakouts
Reversal breakouts begin similarly to continuation breakouts in that there is usually a halt or consolidation following a protracted trend.

The only difference is that the price moves in the opposite or reverse direction following this consolidation. This is because Forex traders collectively decided that the trend has run its course.
BONUS: Breakout trading strategy trick
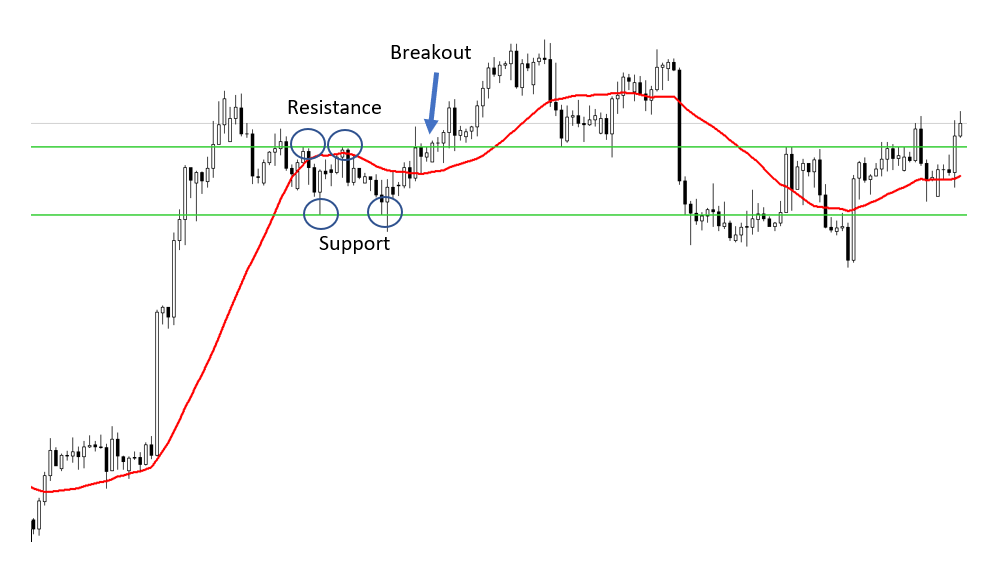
One of the popular techniques for trading breakouts is to combine the MA indicator with support and resistance levels.
To begin, we will set up the 25 MA as shown on the chart.

We can see that the price began to trend upwards, then entered a consolidation period. Afterwhich, we can set the support and resistance levels. After this, we may prepare for any breakout.
Following an uptrend, the price moves into a consolidation area, then breaks out, forming a continuation breakout.
Now, it’s your turn. Try this trick and find out how much you can profit from a breakout.
Ready to grow your wealth in the world's largest financial market? No better place to start than right here with us! Start trading with Fullerton Markets today by opening an account:

You might be interested in: Top 5 Methods to Generate Passive Income from the Forex Market