
Most traders often learn how to use indicators or tools for trading when they first enter the Forex market. However, after a while, they will realise that trading with indicators does not reflect the actual price of the market, and most indicators are lagging behind the price.
As a solution, we will show you how to use a trading method used by many experienced traders around the world - Price Action Trading.
What is price action trading?
Price action trading is a strategy that helps you to make trading decisions based on “naked” charts or a few minimalistic indicators. This means that you will not use indicators that are lagging. Sometimes, you just have to use a few moving averages to identify trends or support and resistance areas.
Learn more about the 5 Most Popular Forex Indicators: Definition, Pros and Cons
The price chart reflects the beliefs and actions of all the participants in the market. These beliefs manifest on the price chart of the market in the form of price action. Traders can then make their own trading decisions, without using information from indicators or other important news.
Price movements also provide traders with what is collectively known as price action trading strategies, which are signals that will help a trader understand the market's price movement, as well as predict how it will move in the future.
Because these signals have a high degree of accuracy, they're all you need to develop a trading strategy/system that is profitable and with high probability.
What does “pure” or “naked” price action mean?
“Pure” or “Naked” price action means that the trader uses the chart without any supporting indicators like MACD, Stochastics, RSI, or others.
What are the pros and cons of price action trading?
Pros
- Provides traders with a pure chart rather than one with multiple indicators, which may result in a distorted reality.
- Eliminates the possibility of multiple indicators showing opposing outcomes simultaneously.
Cons
- Different traders may see different outcomes of price actions.
- Different traders may have different interpretations of the same price action information.
- Requires focus and sufficient knowledge on price action for it to be used effectively.
How to trade with price action?
Before you trade using price action, you should remove all the annoying indicators and other unnecessary variables from your chart. Once that is done, you can start identifying key chart levels and looking for price action setups to trade.
Some of the tools you’ll need for price action trading are:
- Candlesticks
- Trendlines
- Support and resistance
- Patterns
Strategies used for price action trading
There are many strategies you can use to trade with price action like breakout, retest, head and shoulders, wedges, flags, etc. In this article, we will focus on breakout and retest strategies.
Breakout strategy
The breakout trade is the answer when prices are moving outside of the levels of support and resistance. This normally happens when major news announcements are made and traders around the world rush in to buy and sell.
The news creates heavy momentum and causes prices to breakthrough levels of support and resistance, especially when the data misses market expectations.
Timeframe: Any timeframe. It is recommended to use the indicators from M15 to D1.
Indicators: Do not use excessive indicators for this strategy.
Currency Pairs: Any market pair is applicable, especially the 7 major currency pairs.
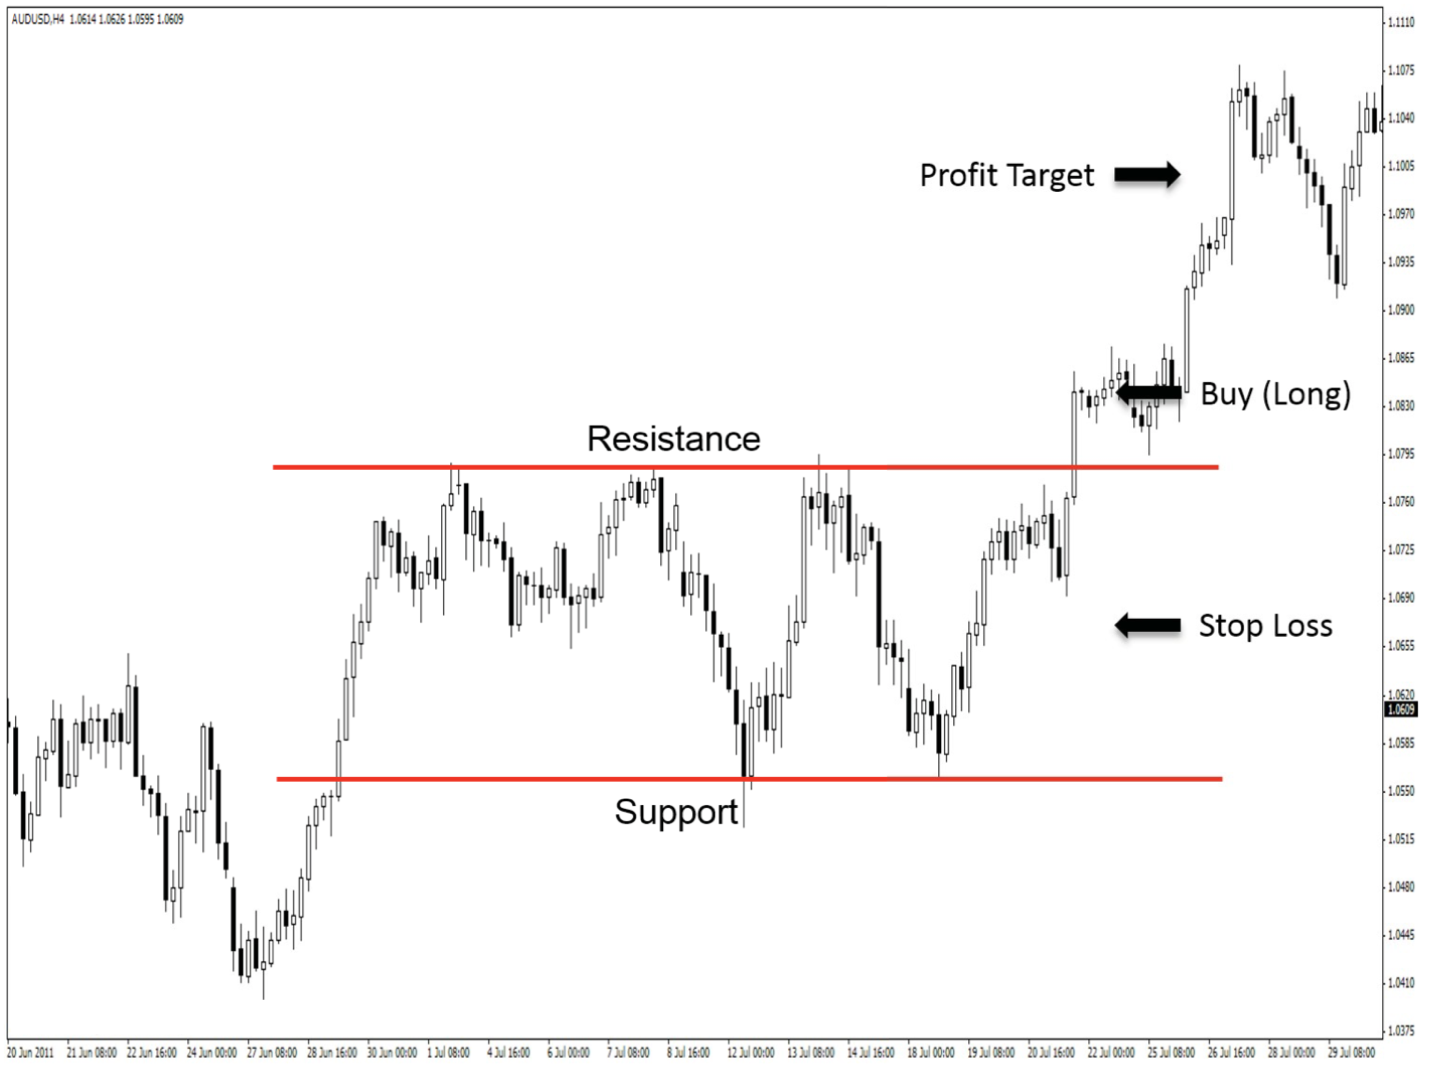
Breakout strategy setup
Long Trade:
1. Mark out support and resistance levels.
2. Entry: When the price closes above the resistance level.
3. Stop-loss: At the midpoint of the range.
4. Take profit: At a ratio of 1:1

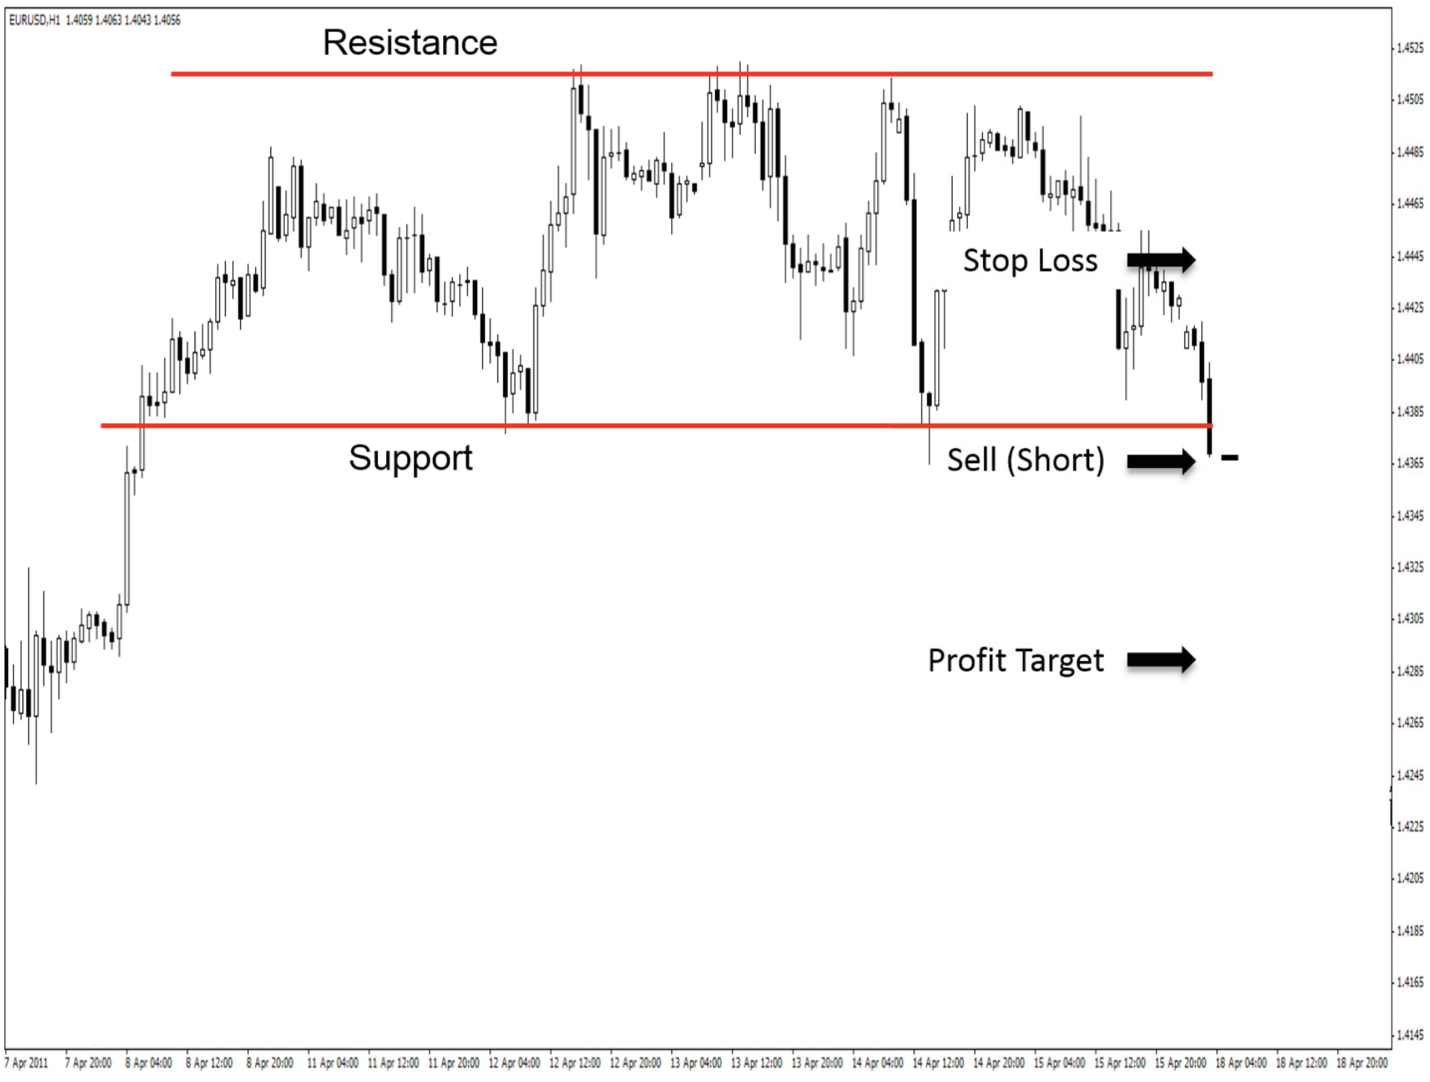
Short Trade:
1. Mark out support and resistance levels.
2. Entry: When the price closes below the support level.
3. Stop Loss: At the midpoint of the range.
4. Take Profit: At a ratio of 1:1

Retest Strategy
Retest Strategy is finding trading points at support and resistance levels when the market is trending.
Timeframe: Any timeframe. It is recommended to use the indicator from M15 to D1.
Indicators: Do not use excessive indicators for this strategy.
Currency Pairs: Any market pair is applicable, especially the 7 major currency pairs.
Retest strategy setup
Long trade:
1. Identify market trends.
2. Mark out resistance levels at the high.
3. Entry: When the price moves above the resistance level and goes back to test that resistance level.
4. Stop-loss: Below the previous bottom.
5. Take profit: At a ratio of 1:1

Short Trade:
1. Identify market trends.
2. Mark out support levels at the high.
3. Entry: When the price moves below the support level and goes back to test that support level.
4. Stop Loss: Above the previous top.
5. Take Profit: At a ratio of 1:1

If you are a trader who loves simplicity and minimalism, you’re going to love being a “Pure” or “Naked” Price Action trader. No matter what strategy you are trading with, understanding Price Action will help you to improve and trade better.
We hope that this article on Price Action will guide you on a more profitable trading journey!
Ready to grow your wealth in the world's largest financial market? No better place to start than right here with us! Begin trading with Fullerton Markets today by opening an account:

You might be interested in: 8 Forex Trading Traps You Must Avoid