

A trading approach rooted in technical analysis tends to simplify Forex trading on the basis of price action. But with all the technical indicators available, choosing the best one or two can feel overwhelming.
This is why we narrowed down your options to the top five technical indicators most Forex traders use and those you should know and apply in your own trading activities.
1. Bollinger Band
A Bollinger Band is a technical analysis indicator developed by John Bollinger, thus the name. It is used to identify short-term price movements and to measure how volatile the market is.
It is shown on the chart as two trendlines moving on two standard deviations, representing positive and negative movements away from a simple moving average (SMA). You can use the Bollinger Bands to discover opportunities to make a higher profit or identify if an asset is overbought or oversold.
How it works:

- As shown in the image above, there are three lines that make up the Bollinger Bands – the upper and lower bands, and the simple moving average line in between the two bands.
- This indicator uses two parameters – Period and Standard Deviations with default values of 20 and 2, respectively. The combination can be customised according to your preference.
- If the bands tighten/narrow, it signals low market volatility. The squeeze, as this condition is called, indicates sharp price movements and future increased volatility that triggers trading opportunities.
- If the bands widen or move away from the SMA, volatility is likely to increase and any existing trend may end. This could be the best time to exit a trade.
- When price action breaks above or below the bands, a trading breakout occurs.
Learn How to Trade in a Slow Forex Market (Low Volatility)
Pros and Cons of Using Bollinger Bands
Pros
- Useful in applying and helping with momentum, trends, and volatility.
- Provides a strong indicator of market volatility as the bands narrow or widen.
- Helps identify new trends and when a trend ends.
Cons
- Not a standalone system
- Can't predict price pattern
Since Bollinger Bands mainly provide information regarding price volatility, they can’t be used all by themselves. They must be combined with other non-correlated indicators. John Bollinger suggests using relative strength index (RSI), moving average divergence/convergence (MACD), and on-balance volume.
2. Moving Average (MA)
A moving average is a statistic that captures the average change in a data series over time. As a technical indicator, it represents the average closing price over a specific period and indicates market momentum. MA on an upward trend can mean an upswing in momentum or price, while a downward trend is considered a decline.
Today, there is a wide variety of moving averages to choose from, ranging from simple measures to complex formulas that require a computer program to efficiently calculate.
How it works:
- MA is calculated so that clear data of price movement is shown over a specific period. This is done by creating an average price that is constantly updated.
- MA can be simple or exponential. Simple moving average (SMA) is calculated based on the arithmetic mean of a given set of prices spread over a certain number of days such as 15, 100 or 200 days. Traders who prefer using longer timeframes prefer SMA.
- Exponential moving average (EMA) is a weighted average that focuses more on current prices. Because it is more responsive to new information, it's popular among traders who prefer intraday trading or trading on shorter timeframes.
For trading on a lower timeframe, we can set the period for SMA to 5-20 days. For a larger timeframe, we can set the period of the SMA to 100-200 days.
There are 2 ways to use moving averages (SMA or EMA) to tell a trend:
1. Look at the slope of the moving average. If the slope of the moving average is continuously moving higher, this shows an uptrend. On the other hand, if the slope of the line is continuously moving lower, then there is a price running below the moving average, indicating that it is a downtrend.
2. Look at the crossover of two moving average lines, with one being the shorter period number of days and a longer period number of days. For example, we can use the 5-day EMA with the 50-day EMA. If the 5-day EMA cuts above the 50-day EMA line, this means that it is an uptrend. If it moves in the opposite direction, then it is a downtrend.
Below is an example of how to find a trend based on the intersection of two moving averages. The red line indicates EMA5, while the blue line indicates EMA50.

Pros and Cons of Using Moving Average (MA)
Pros
- SMA offers a smooth line that is less affected by temporary price swings
- EMA responds quickly to rapid changes in price
- EMA is great for trading intraday swing highs and lows
- Simple and attractive enough for newer and algorithmic traders
- Simplifies trading and helps prevent or deal with paralysis by analysis
Cons
- SMA is slow to respond when price changes rapidly
- EMA is prone to false signals and back-and-forth whipsawing
When the market is extremely volatile, the average movements obtained could be skewed. This makes the timing of entering the market inaccurate. Since it changes too quickly from the ups and downs of the market, it may be called noise.
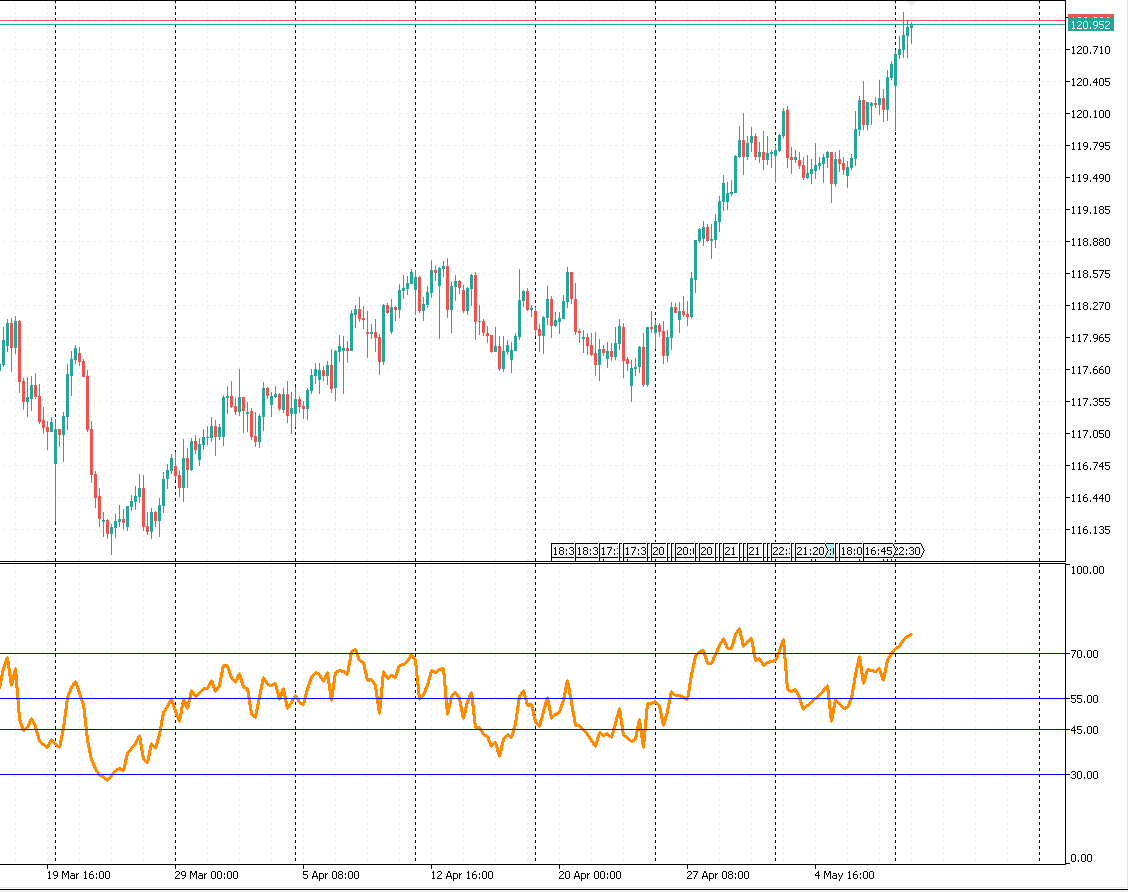
3. Relative Strength Index (RSI)
Relative Strength Index (RSI) is used to measure price momentum, the speed with which prices move and the level of change that occurs. It was originally developed by J. Welles Wilder Jr. and was featured in his 1978 book New Concepts in Technical Trading Systems, along with other technical indicators such as Parabolic SAR and average directional index (ADX).
Basically, RSI measures how quickly traders bid up or down a security's price. This is then plotted on a chart based on a scale from 0 to 100.
- RSI reading below 30 indicates a stock is oversold
- RSI reading above 70 indicates a stock is overbought
How it works:
The RSI provides technical traders with signals on whether price momentum is bullish or bearish. You'll see it beneath an asset price's graph.
What is an RSI Buy Signal?
It is considered a buy signal if the RSI moves below 30. The idea behind this is that an asset has been oversold and is likely to go on a rebound. How soon the rebound can happen, however, will depend on whether an asset is moving in a significant downtrend. In this case, you should wait for a confirmatory signal to buy before you do.
Pros and Cons of Using Relative Strength Index (RSI)
Pros
- Helps find key reversal levels
- More effective when used in non-trending zone
- Easy to understand and implement
- Can be used to find momentum loss
Cons
- May provide false signals in a trending zone
- Completely ignores volume during key reversals
It’s not recommended to use RSI alone as a trading signal. This is because there is a high chance of error, depending on the context of the overall chart. To make an informed decision, take into account the formation of price trends, various candlestick patterns, and other key data.
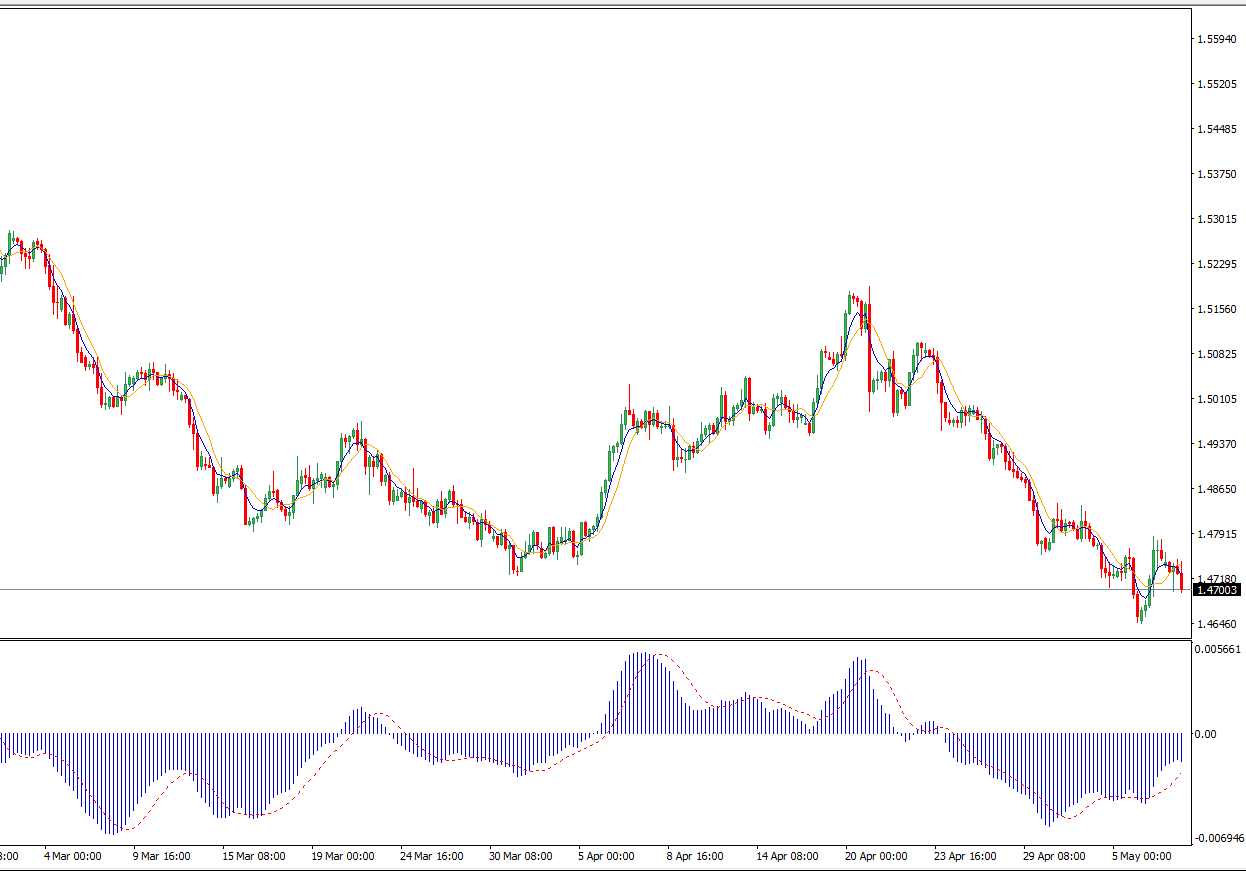
4. Moving Average Convergence Divergence (MACD)
Moving average convergence divergence (MACD) is a trend following momentum indicator that shows how a security price's moving average relates with another. On a trading chart, MACD is shown with several lines:
- The MACD line is a result of subtracting the exponential moving average (EMA) between 26 and 12 periods.
- The signal line is a result of the 9-day EMA of the MACD.
Plotted on the chart, the signal line can trigger a buy or sell signal. The basic rule is to sell or short when the MACD crosses below the signal line and buy or long when it moves above.
MACD is popularly used to interpret crossovers, divergences, and rapid rises/falls. It also shows a trader when conditions are overbought or oversold.
How it works:
Apart from providing technical signals to buy or sell, MACD will also show:
- If the market is overbought or oversold based on how fast a crossover happens.
- If the price's bullish or bearish movement is going strong or weak.
- If a price's trend direction or severity will change.
- If a price's recent momentum may trigger a change in its underlying trend.
Basically, MACD helps a trader identify when to enter, exit, or add to their position.
MACD is primarily a lagging indicator since it uses data based on the history of a stock's price action. This means it has to “lag” the price. However, because some traders use MACD histograms to predict when a trend may change, it's also viewed as a leading indicator.
As for divergence, a bullish divergence occurs when the price is making lower swing lows while the indicator is making higher lows. Bearish divergence happens if the opposite scenario occurs.
Pros and Cons of using Moving Average Convergence Divergence (MACD)
Pros
- Provides a clear signal when to buy (crossover) and sell (divergence)
- Used as both a trend and momentum indicator
- Enhances clarity during analysis when used with other technical indicators
Cons
- Can provide reversal signals that won't result in a significant reversal but only a sideways move or temporary pause
- May provide less accurate analysis of a trend
MACDs give trade signals quite often at relatively close price ranges before the formation of a strong sideways signal. This is likely to result in a small amount of loss several times in a row.
5. Average Directional Movement Index (ADX)
Average Directional Movement Index (ADX) is a technical indicator that is used to measure a trend's overall strength. The DX component is used to calculate the ADX indicator.
ADX is a component of the Directional Movement System that J. Welles Wilder Jr. also developed. The system attempts to identify how strong prices move in positive or negative directions and are represented by positive directional movement indicator (DMI+) and negative directional movement indicator (DMI-), respectively.

How it works:
- DX is used to measure the market's trendiness, ranging from 0 to 100. The higher it is, the more directional the market moves. The trend is strong if the value of DX increases and the spread between DMI+ and DMI- also increases.
- ADX above 25 indicates a strong trend
- ADX below 20 indicates there's no trend
- ADX that drops from high values may mean a trend is ending. Additional research is needed to confirm that open positions can be closed.
- ADX that declines indicate that the current trend is weakening and the market is becoming less directional. Because the trend is changing, it's recommended to avoid trading trend systems.
- ADX that rises by 4 or 5 units after staying low for a long time may signal an opportunity to trade the current trend.
- ADX that's rising indicates that a strengthening trend is present in the market.
- The value of ADX tends to flatten out when a trend moves in a constant slope.
Pros and Cons of Using Average Directional Movement (ADX)
Pros
- Can quantify the strength of a trend
- Effectively filters trades during accumulation periods
- Can identify trending conditions in Forex
- Works best for day trading and swing trading
- Can show a clear indication of the strength of bulls and bears simultaneously
Cons
- Lagging indicator following price movement
- Shows false signals when used on shorter timeframes
- Must be used with other indicators to properly analyse price action
When ADX moves up or down, it doesn't mean that the asset price will move concurrently. This is because both uptrend and downtrend ADX indicate strength in either an up or down direction.
Using any or a combination of the indicators listed above will make Forex trading less complicated. You just need to set clear rules as to how you're going to use these indicators to your advantage.
Ready to grow your wealth in the world's largest financial market? No better place to start than right here with us! Begin trading with Fullerton Markets today by opening an account:

You might be interested in: Top 5 Methods to Generate Passive Income from the Forex Market


